We conducted a load test on Oracle Cloud Infrastrcuture to benchmark and improve the performance of kuvasz-streamer.
The target of 10,000 tps and 1s latency was achieved after extensive tuning and re-architecting the streamer: the streamer now opens a fixed number of connections to the destination database and batches operations committing every one second.
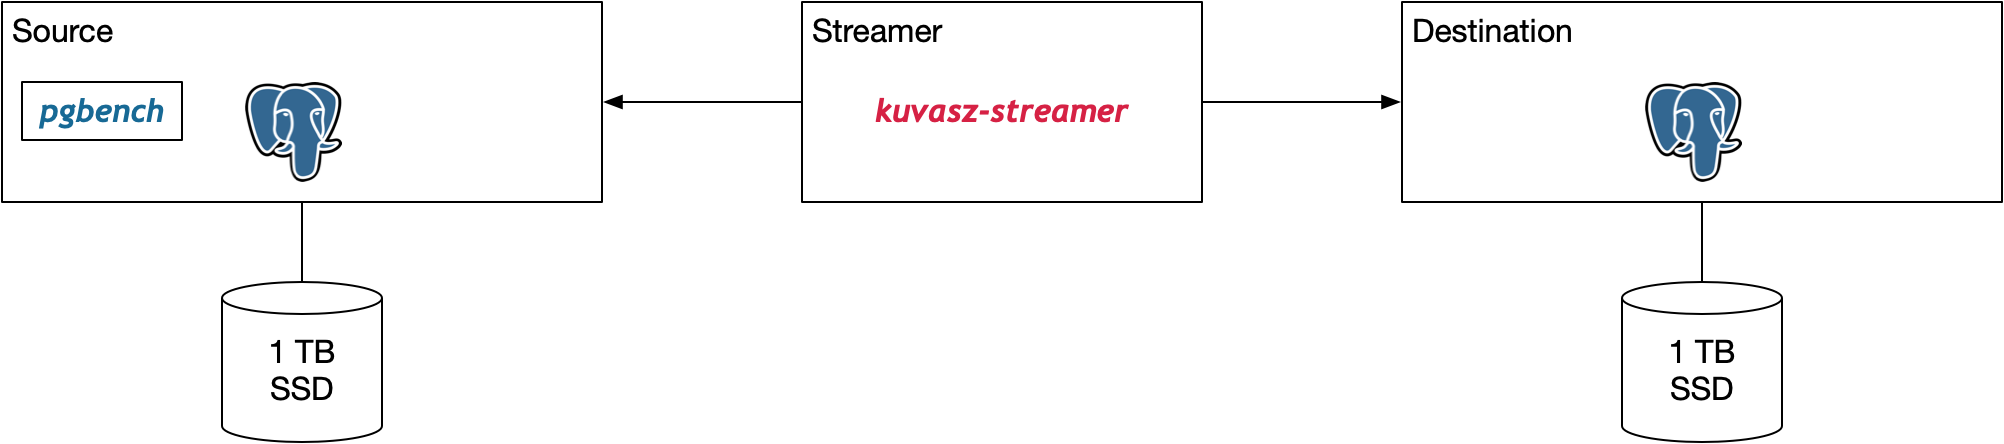
The test setup consists of a load generator and a source PostgreSQL instance on a VM, a streamer and a destination PostgreSQL instance. The source and destination databases have similar specifications.
Virtual machines
The chosen virtual machines have the following specifications:
| Parameter |
Source/Destination |
Streamer |
| Shape |
VM.Standard.E5.Flex |
VM.Standard.E5.Flex |
| Processors |
4 |
4 |
| Threads |
8 |
8 |
| Model |
AMD EPYC 9J14 96-Core @ 2.4 GHz Base, 3.7GHz Turbo |
AMD EPYC 9J14 96-Core @ 2.4 GHz Base, 3.7GHz Turbo |
| Memory |
64 GB |
32 GB |
| Network |
4 Gbps |
4 Gbps |
| Boot disk |
50 GB |
50 GB |
| Data Disk |
1TB |
- |
| Data Disk Speed |
25,000 IOPS |
- |
| Data Disk Bandwidth |
480 MB/s |
- |
| Operating System |
Ubuntu 22.04.4 LTS |
Ubuntu 22.04.4 LTS |
| Kernel |
5.15.0-1052-oracle |
5.15.0-1052-oracle |
Test setup
We have chosen pgbench running in TPC-C mode as the load generator.
The database is initialized with 10 partitions and a scale of 1000 using the following command:
pgbench -U pgbench -i -s 1000 --partitions=10 pgbench
This leads to the following table sizes:
| Table |
Size |
| pgbench_accounts |
100,000,000 |
| pgbench_tellers |
10,000 |
| pgbench_branches |
1,000 |
| pgbench_history |
0 |
and a total database size on disk of: 30GB
Test run
The test run was performed using the following command:
pgbench -U pgbench -c 10 -j 4 -P 5 -T 3600 --rate=2500 pgbench
This command runs 10 clients and 4 threads. The test runs for 1 hour and the rate is set to 2500 tps. Each transaction consists of a single INSERT and three UPDATE operations thus generating a total of 10,000 operations/s.
| Parameter |
Value |
| Clients |
10 |
| Threads |
4 |
| Duration |
1h |
| Transactions |
2,500 tps |
| Select |
2,500 tps |
| Insert |
2,500 tps |
| Update |
7,500 tps |
| Total |
10,000 tps |
Results
All systems are monitored using Grafana with metrics extracted using grafana-agent, kuvasz-agent and stored in Mimir.
System utilization
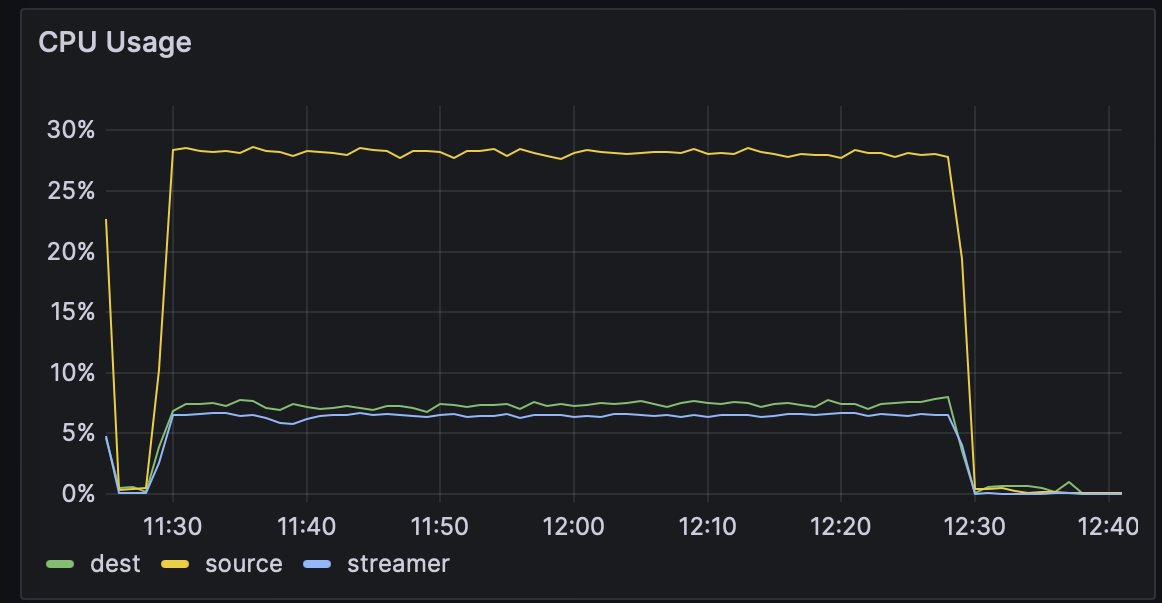
The CPU graph shows a 27% utilization on the source and only around 7% on the destination: this is mostly due to the transaction optimization.
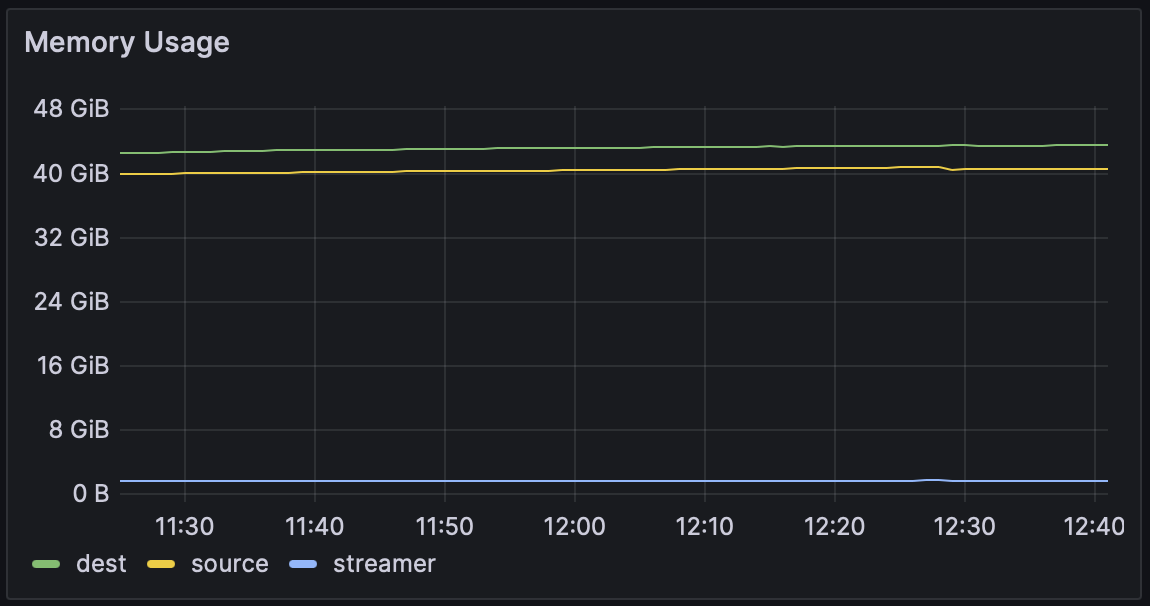
The memory utilization is stable at 40 GB showing Postgres is fullly using the RAM as cache.
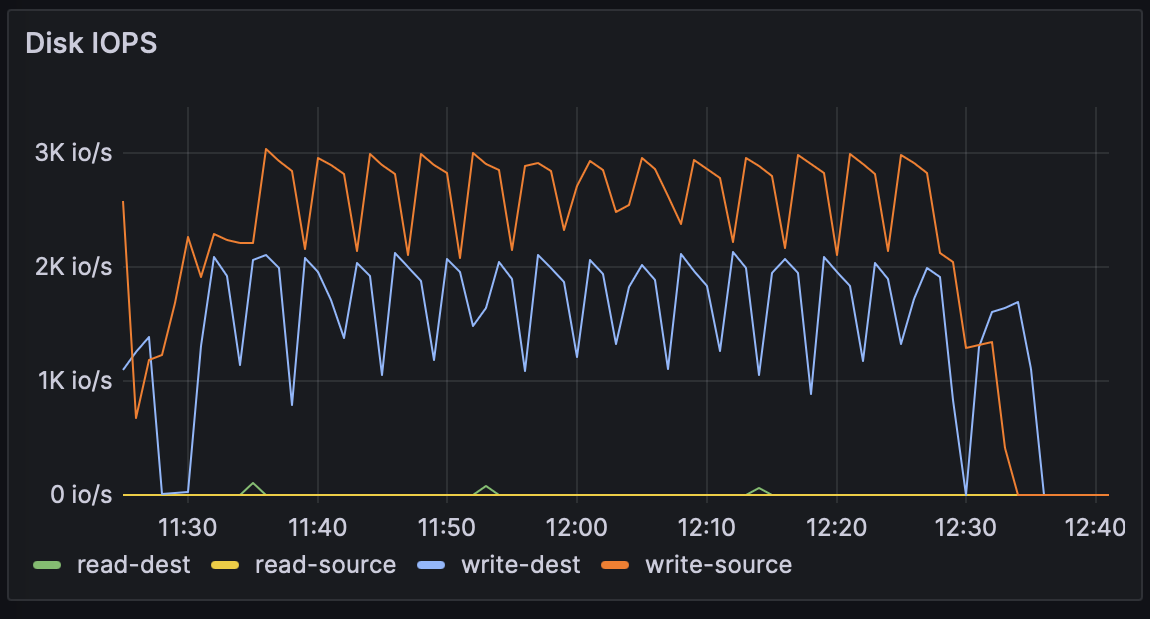
Disk utilization shows around 3K IOPS on the source and 2K IOPS on the destination. Again this is due to the optimization of the number of transactions performed. The 5-minute dips are caused by checkpointing.
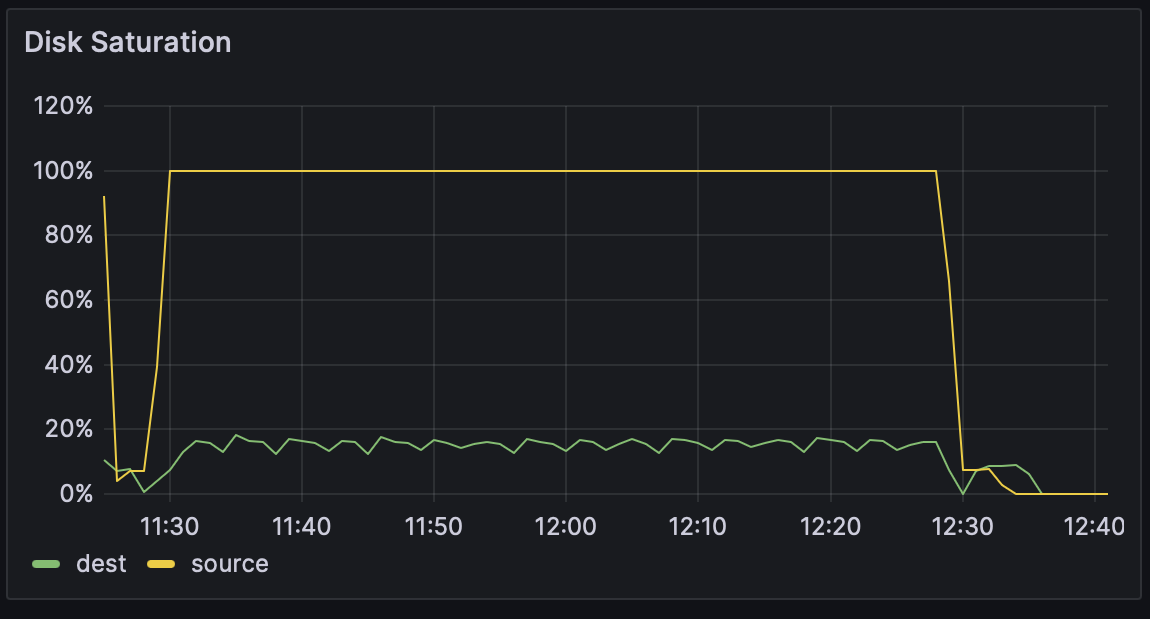
Disk saturation is interesting as the figures coming from the source system seem wrong: it was possible to increase the throughput from 2000 to 10000 tps without any problems while still at 100% saturation.
Postgres performance
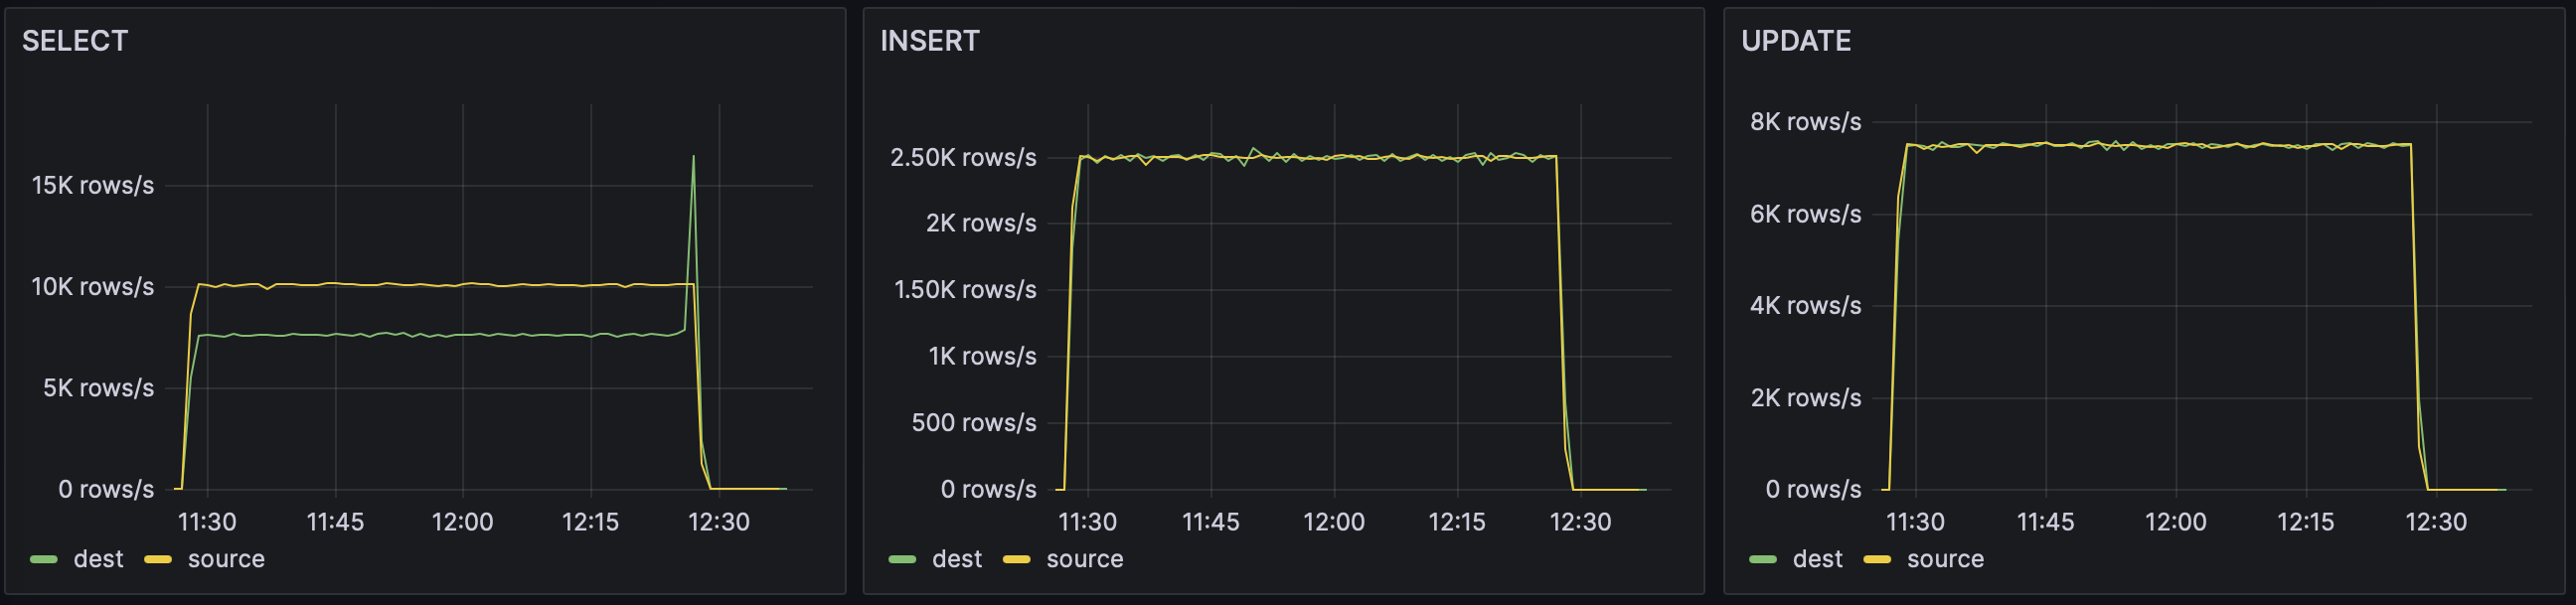
The graphs below show a sustained and consistens performance in terms of SQL operations: The SELECTs are not refleced on the destination while the INSERTs and UPDATEs are completely identical.
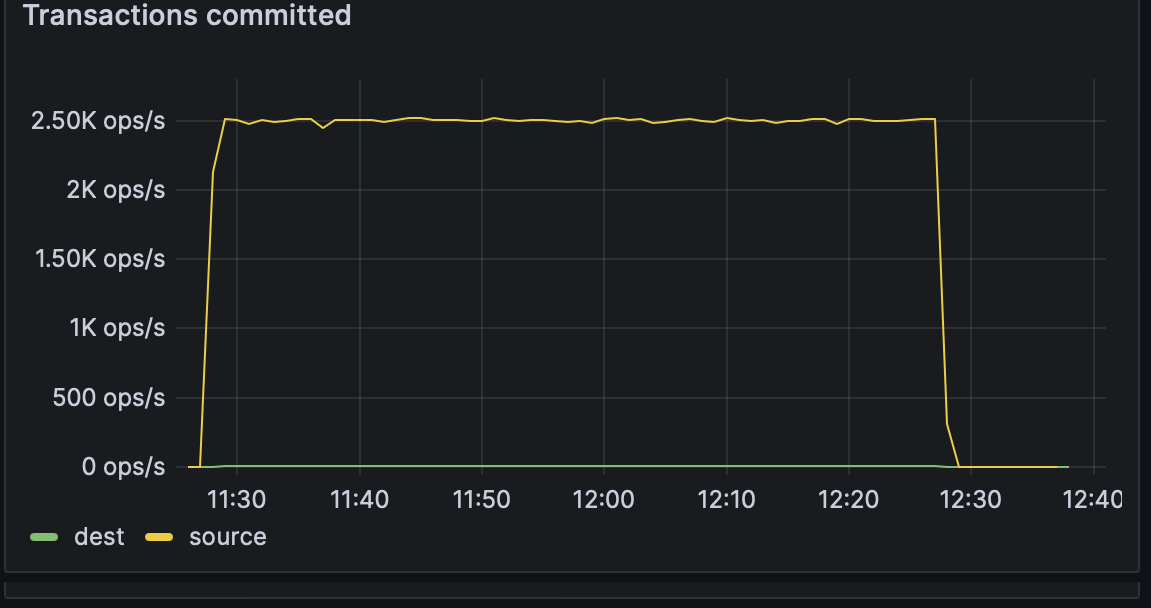
The transactions graph shows a consistent 2500 tps on the source and 2 tps on the destination.
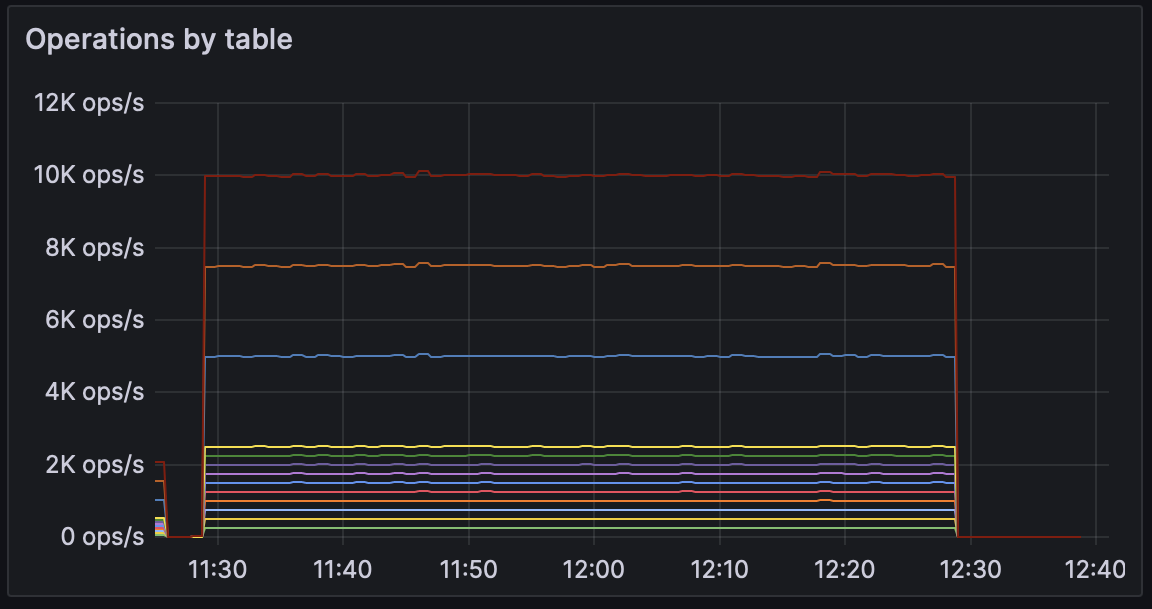
kuvasz-streamer generates prometheus metrics with labels for: source database, table and operation. The graph below show a cumulative performance of 10,000 tps grouped by destination table.
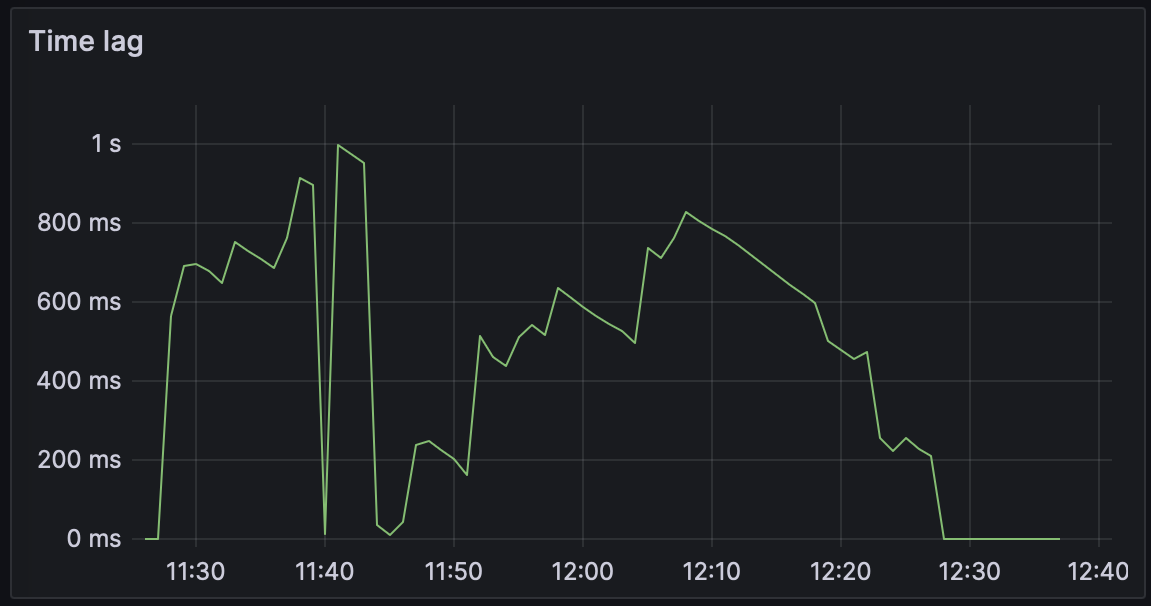
The most important figure in the test is the lag. We show here a lag of less than 1 second during the whole duration of the load test.